Simple spheres
In this example we will go through how to visualize simple spheres using ZnVis.
Imports
The first thing to do is import the required packages. For this tutorial, we use both numpy as znvis.
import znvis as vis
import numpy as np
Setting up a particle
Now we can make a particle that ZnVis can visualize. Let’s start with some fake data generated randomly and then add this data to a particle.
trajectory = np.random.uniform(-10, 10, (100, 50, 3))
mesh = vis.Sphere(radius=2.0, colour=np.array([30, 144, 255]) / 255, resolution=10)
particle = vis.Particle(name="Blue", mesh=mesh, position=trajectory)
In this code we first generate fake trajectory data for 50 particles over 100 time
steps, define the shape of the particle as a blue sphere and add this information to
the znVis.Particle class.
Now let’s do this for the second particle.
trajectory_2 = np.random.uniform(-10, 10, (100, 50, 3))
mesh_2 = vis.Sphere(radius=1.0, colour=np.array([255, 140, 0]) / 255, resolution=10)
particle_2 = vis.Particle(name="Orange", mesh=mesh_2, position=trajectory_2)
Build and run the visualizer
Now that the particles are prepared, we can set up the visualizer and run it.
visualizer = vis.Visualizer(particles=[particle, particle_2], frame_rate=20)
visualizer.run_visualization()
Here we have passed two particle instances to the visualizer along with a frame rate measured in frames per second.
Results
You should now see a screen that looks something like this:
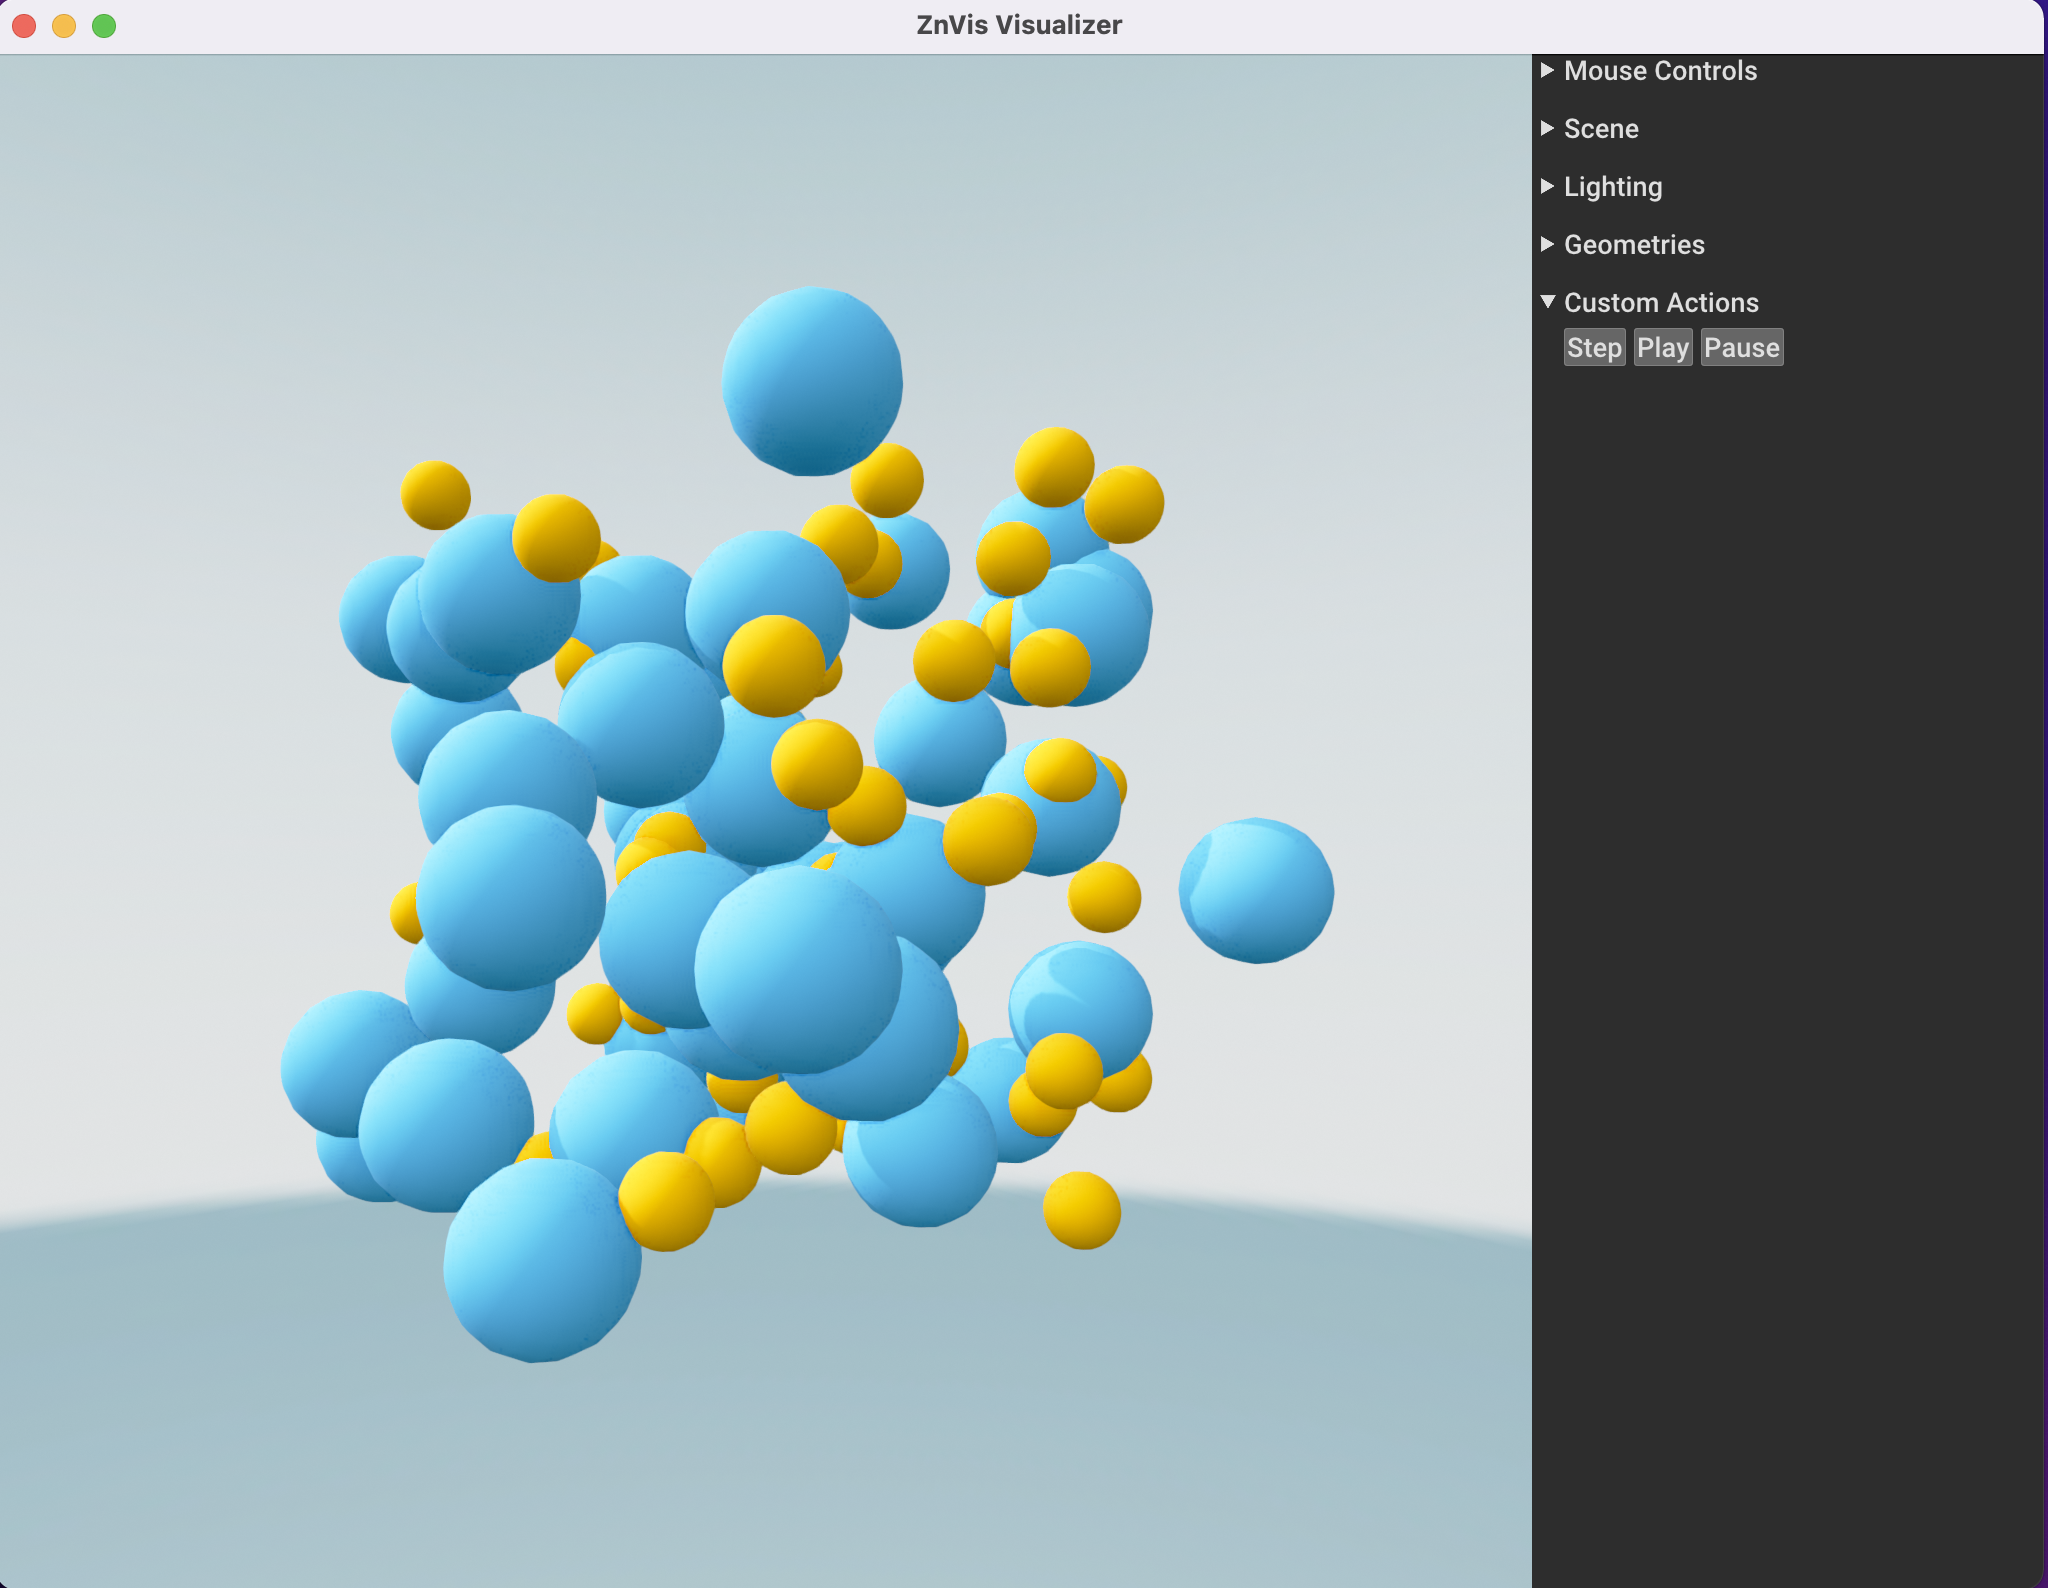
If you now press the Play button the particle should start moving.